The mean absolute deviation is a way to measure the dispersion for a set of data values.
A low value for the mean absolute deviation is an indication that the data values are concentrated closely together. A high value for the mean absolute deviation is an indication that the data values are more spread out.
The formula to calculate the mean absolute deviation is as follows:
Mean absolute deviation = (Σ |xi – x|) / n
- Σ – just a fancy symbol that means “sum”
- xi – the ith data value
- x – the mean value
- n – sample size
This tutorial explains how to calculate the mean absolute deviation of a dataset in Google Sheets.
Example: Mean Absolute Deviation in Google Sheets
Use the following steps to calculate the mean absolute deviation in Google Sheets.
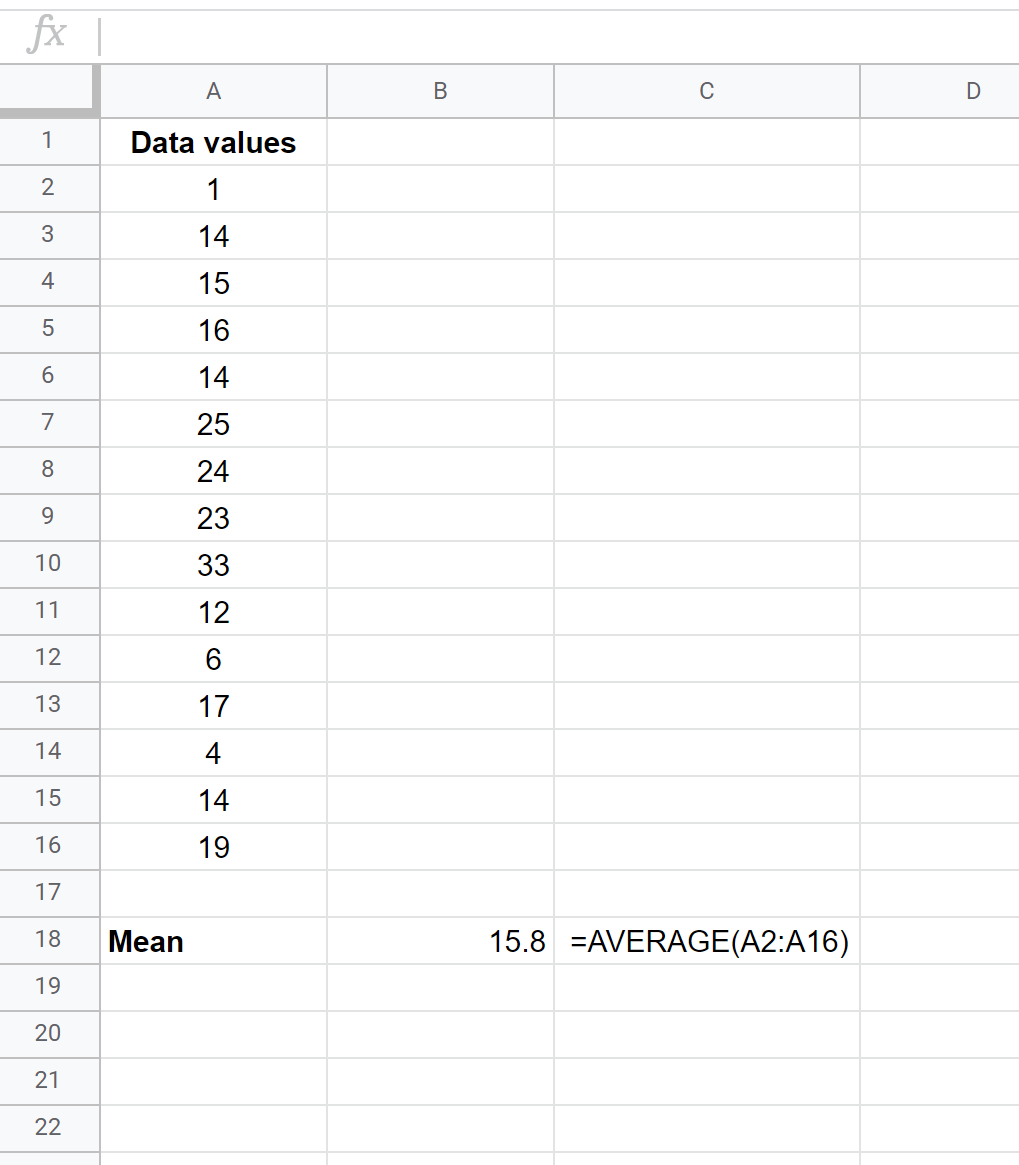
Step 1: Enter the data.
First, enter all of the values of a dataset into one column:

Step 2: Find the mean value of the dataset.
Next, use the AVERAGE() function to find the mean of the dataset:
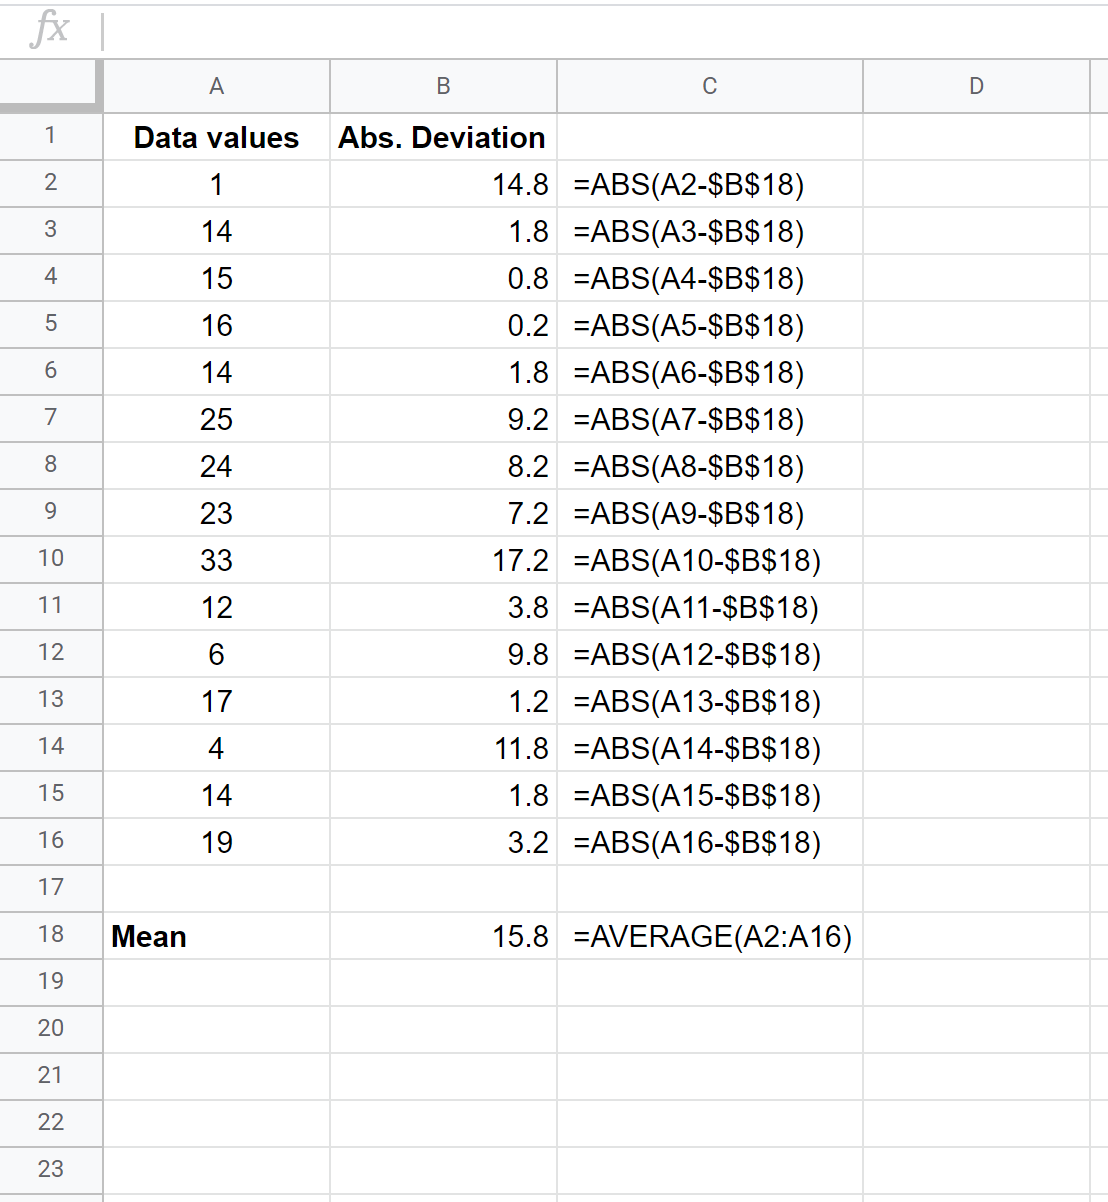
Step 3: Calculate the absolute deviations.
Next, use the ABS() function to find the absolute deviation of each observation from the mean of the dataset:
The formulas in column C show how to calculate the values in column B.
Step 4: Calculate the mean absolute deviation.
Lastly, calculate the mean absolute deviation of the dataset:
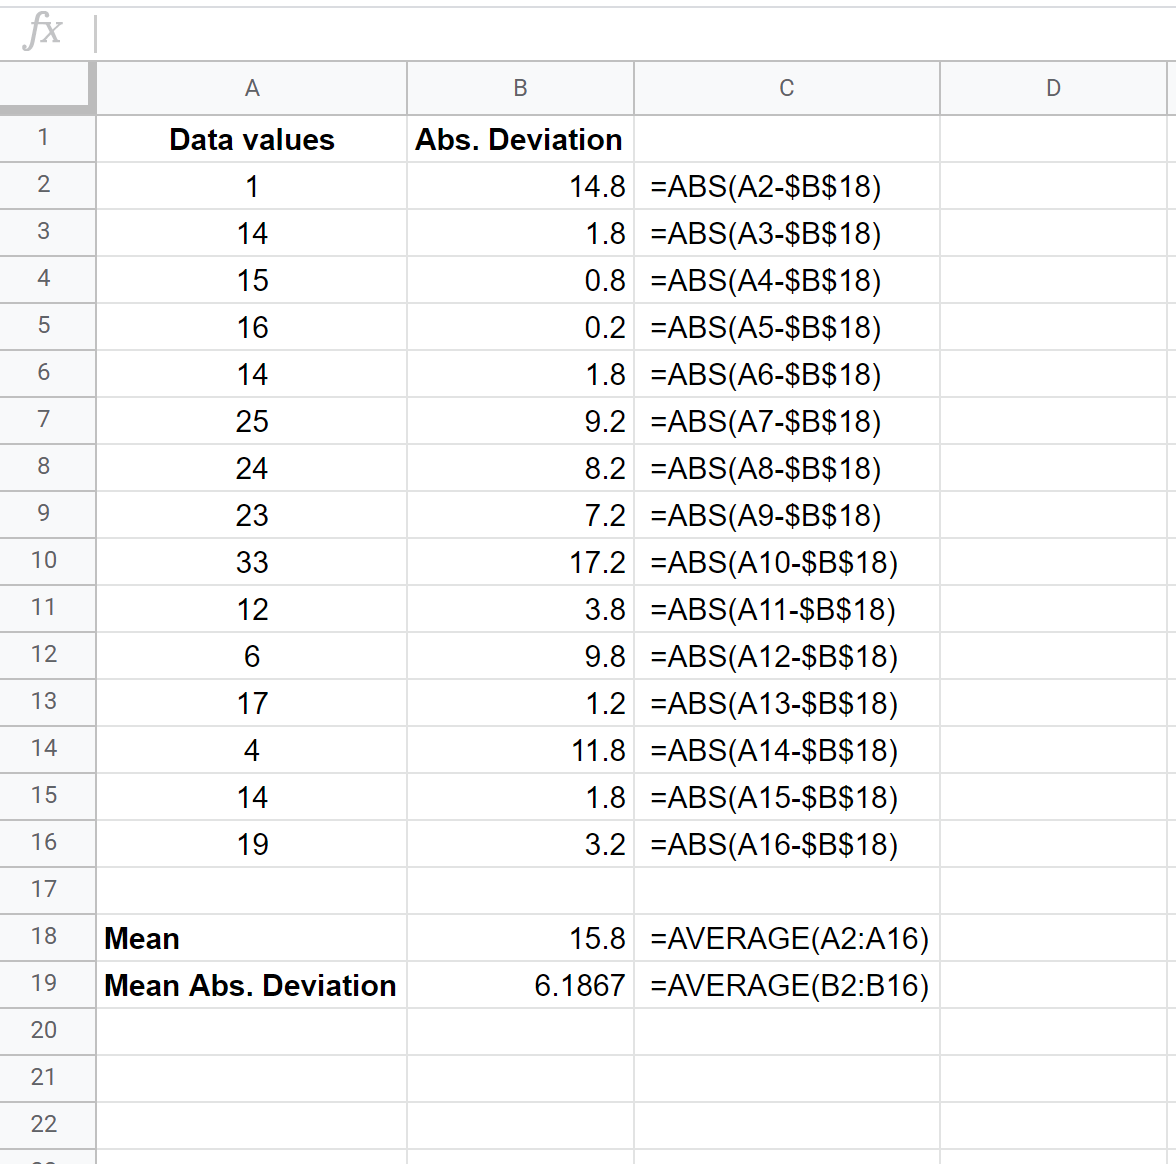
The mean absolute deviation turns out to be 6.1867.
Note that you can use these four steps to calculate the mean absolute deviation for any number of data values. In this example, we used 15 data values but you could use these exact steps to calculate the mean absolute deviation for 5 data values or 5,000 data values.
Related: How to Calculate the Mean Absolute Deviation in Excel